
References
Official
- The Java® Language Specification - Java SE 8 Edition
- The Java® Virtual Machine Specification Java SE 8 Edition
- Java Platform, Standard Edition Documentation - Multiple Releases Portal(JDK 7 - 13)
- Java Language and Virtual Machine Specifications - Multiple Releases Portal(Java SE 6 - 13)
Excellent
- Java 全栈知识体系
Terminology
Java Programming Language
Java 是一门面向对象的编程语言并有以下特性:
- 平台独立、跨操作系: Java 程序被编译为字节码,运行在 JVM 中,JVM 支持多种操作系统,因此一套程序可以运行在不同的操作系统上。
- 面向对象: 封装、抽象、继承、多态
- 自动垃圾收集: 由 JVM 进行内存管理,垃圾回收
- 丰富的标准库: Java 提供了很多标准库如 IO、网络、日期操作等等。
Java Runtime Edition(JRE)
JRE includes Java Virtual Machine(JVM), Java platform core classes and supporting Java platform libraries。
- Java Virtual Machine: Java 虚拟机,为了实现跨平台/操作系统,Java 使用 JVM 屏蔽了与具体平台相关的信息(JVM 对不同操作系统有不同的实现,将字节码转换成对应平台的机器码),这样 Java 的编译程序只需生成在 JVM 上运行的目标代码(字节码),就可以在多种平台上不加修改地运行。
- Java API: 应用程序编程接口,是开发人员用于创建 Java 应用程序的预打包库的集合。Java API 通过提供工具类来完成许多常见的编程任务,比如字符串操作,日期/时间处理,网络和实现数据结构(列表,映射,堆栈和队列),使开发更容易
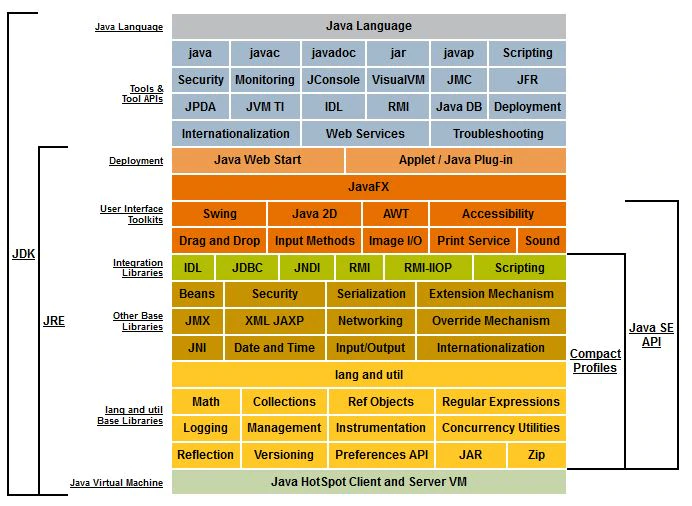
- Java SE Platform at a Glance:
Java Development Kit
JDK 是一组用于开发 Java 应用程序的工具(如javac、javap、java、jar、jps…),使用 JDK,可以编译 Java 程序并在 JVM 中运行,还提供了用于打包和分发应用程序的一组工具。JDK 和 JRE 共享 Java API
JDK = JRE + A collection of tools for developing Java applications
Java Tools and Commands Reference
Mac 各版本的 JDK 默认安装路径/Library/Java/JavaVirtualMachines/,执行/usr/libexec/java_home -V可以查看已安装JDK。
JVM 相关命令在/System/Library/Frameworks/JavaVM.framework/Versions/Current/Commands可以找到(当然在 JDK 的默认安装目录也能找到),有很多命令和工具。
可以使用info或者man查阅当前版本JDK Tools命令的详细介绍,例如查看java命令可以使用info java或者man java。也可以通过 Oracle 官网查看:
JMX
JMX(Java Management Extensions)是管理 Java 的一些扩展。这种机制可以方便的管理、监控正在运行中的 Java 程序。常用于管理线程,内存,日志 Level,服务重启,系统环境等。jdk6+,Java 程序启动时都会在 JVM 内部启动一个 JMX Agent,JMX Agent 会启动一个 MBean Server 组件,把 MBeans(Java 平台标准的 MBean + 你自己创建的 MBean)注册到它里面,然后暴露给 JMX Client 管理。简单来说就是每个 Java 程序都可以通过 JMX 来被 JMX Client 管理,而且这一切都是自动发生的。而 VisualVm 就是一个JMX Client。
要启用 JMX,需要在 Java 进程启动的时候指定几个参数
com.sun.management.jmxremote: 开启 JMXcom.sun.management.jmxremote.port: 指定 JMX 暴露的端口。com.sun.management.jmxremote.rmi.port: 指定 RMI Connector 端口,可以和com.sun.management.jmxremote.port保持一致。com.sun.management.jmxremote.ssl: 指定是否使用 SSL,在开发环境下可以是false,但是在生产环境下强烈建议为true。com.sun.management.jmxremote.authenticate: 指定是否需要密码才能够创建 JMX 连接。com.sun.management.jmxremote.local.only: 是否只能本地访问
启动我们要被监控的 Java 程序
$ java \
-Dcom.sun.management.jmxremote \
-Dcom.sun.management.jmxremote.authenticate=false \
-Dcom.sun.management.jmxremote.ssl=false \
-Dcom.sun.management.jmxremote.port=1100 \
-Dcom.sun.management.jmxremote.rmi.port=1100 \
-Dcom.sun.management.jmxremote.local.only=false \
-Djava.rmi.server.hostname=192.168.51.82 \
-XX:+PrintGCDetails \
-XX:+PrintGCDateStamps  \
-Xloggc:/var/log/rockfs/gc.log  \
-XX:+UseConcMarkSweepGC \
-XX:+UseParNewGC \
-XX:MaxTenuringThreshold=15 \
-XX:+ExplicitGCInvokesConcurrent \
-XX:+CMSParallelRemarkEnabled \
-XX:+HeapDumpOnOutOfMemoryError \
-XX:HeapDumpPath=/var/log/rockfs \
-Xmx3g \
-Xms3g \
-jar target/rockfs-server-1.0-SNAPSHOT.jar \
>rockfs.log 2>&1 &
然后在jvisualvm界面jstatd已经建立的远程服务器上右键,添加 JMX 连接...,输入192.168.51.82:1100,不要求SSL连接(N)钩上,确定即可。
-Dcom.sun.management.jmxremote.port=0 表示随机找一个可用的端口,可以使用下面的方式在程序执行时输出实际生成的端口地址
val executorJMX = sun.management.ConnectorAddressLink.importRemoteFrom(0).get("sun.management.JMXConnectorServer.0.remoteAddress")
// ====> JMX Address: service:jmx:rmi:///jndi/rmi://slave023.hadoop-shnew.data.example.com:37806/jmxrmi
println(s"====> JMX Address: $executorJMX")
Java Commands
java
运行已经编译好的 java 程序,Java Options Details
$ java
Usage: java [-options] class [args...]
           (to execute a class)
   or  java [-options] -jar jarfile [args...]
           (to execute a jar file)

# 需要在 src/META-INF/MANIFEST.MF 指定 Main-Class: com.xxx.YourMainApp,然后打成 executable jar
# 否则会出现 Can't execute jar- file: “no main manifest attribute” 的问题
$ java -jar yourapp.jar

# 如果不是一个 executable jar 包,则可以通过下面的方式指定主类
$ java -cp .:yourapp.jar com.xxx.YourMainApp

# 为 jvm 分配可用堆内存
$ java -cp .:yourapp.jar -Xms16g -Xmx16g com.xxx.YourMainApp

# 注意 [options] 必须在 class/-jar 前面,否则会被当作[args...]
$ java -Xms16g -Xmx16g -XX:+UseConcMarkSweepGC -XX:+UseParNewGC -jar rockfs-server-1.0-SNAPSHOT.jar
jar
压缩/解压缩 jar 文件
# 解压缩到当前目录,没有解压缩到指定文件夹的参数,可以将jar包copy到一个空文件夹中,然后解压缩
$ jar -xvf test.jar

# 压缩
$ jar -cvf test.jar *
jps
查看虚拟机进程状况:显示指定系统内所有的 Hotspot 虚拟机进程
# usage
jps [options] [hostid]

# jps 可以通过RMI协议查询开启了RMI服务的远程虚拟机进程状态,hostid为RMI注册表中注册的主机名
# 常用 options;
# -q 只输出LVMID,省略主类名称
# -m 输出虚拟机进程启动时传递给主类main()函数的参数
# -l 输出主类的全名,如果进程执行的是Jar包,输出Jar路径
# -v 输出虚拟机进程启动时的JVM参数
jstat
虚拟机统计信息监控工具,用于收集运行中的 Hotspot 虚拟机各方面的运行数据
$ jstat
Usage: jstat -help|-options
       jstat -<option> [-t] [-h<lines>] <vmid> [<interval> [<count>]]

Definitions:
  <option>      An option reported by the -options option
  <vmid>        Virtual Machine Identifier. A vmid takes the following form:
                     <lvmid>[@<hostname>[:<port>]]
                Where <lvmid> is the local vm identifier for the target
                Java virtual machine, typically a process id; <hostname> is
                the name of the host running the target Java virtual machine;
                and <port> is the port number for the rmiregistry on the
                target host. See the jvmstat documentation for a more complete
                description of the Virtual Machine Identifier.
  <lines>       Number of samples between header lines.
  <interval>    Sampling interval. The following forms are allowed:
                    <n>["ms"|"s"]
                Where <n> is an integer and the suffix specifies the units as
                milliseconds("ms") or seconds("s"). The default units are "ms".
  <count>       Number of samples to take before terminating.
  -J<flag>      Pass <flag> directly to the runtime system.

# 查看可用的 options
$ jstat -options
-class
-compiler
-gc
-gccapacity
-gccause
-gcmetacapacity
-gcnew
-gcnewcapacity
-gcold
-gcoldcapacity
-gcutil
-printcompilation
查看 pid=29732 gc 情况,interval=500ms, samples=5000。
$ jstat -gcutil 29732 500ms 5000
# 具体每列的含义可以通过`info jstat`或者`man jstat`查阅
S0     S1     E      O      M     CCS    YGC     YGCT    FGC    FGCT     GCT
0.00  20.29  12.03   9.84  97.26  92.48     89    0.486     3    0.209    0.695
0.00  20.29  12.03   9.84  97.26  92.48     89    0.486     3    0.209    0.695
0.00  20.29  12.03   9.84  97.26  92.48     89    0.486     3    0.209    0.695
0.00  20.29  12.14   9.84  97.26  92.48     89    0.486     3    0.209    0.695
0.00  20.29  12.14   9.84  97.26  92.48     89    0.486     3    0.209    0.695
0.00  20.29  12.14   9.84  97.26  92.48     89    0.486     3    0.209    0.695
详细的info jstat介绍,不同操作系统不同版本的 JDK 会有差异,下面是OSX jdk1.8.0_231的信息
File: *manpages*, Node: jstat, Up: (dir)
jstat(1) jstat(1)
NAME
jstat - Java Virtual Machine statistics monitoring tool
SYNOPSIS
jstat [ generalOption | outputOptions vmid [ interval [ s|ms ] [ count
] ] ]
DESCRIPTION
The jstat tool displays performance statistics for an instrumented
HotSpot Java virtual machine (JVM). The target JVM is identified by its
virtual machine identifier, or vmid option described below.
NOTE - This utility is unsupported and may or may not be available in
future versions of the J2SE SDK. It is currently not available on Win-
dows 98 and Windows ME platforms.
VIRTUAL MACHINE IDENTIFIER
The syntax of the vmid string largely corresponds to the syntax of a
URI:
[protocol:][//]lvmid[@hostname][:port][/servername]
protocol The communications protocol. If the protocol is omitted
and a hostname is not specified, the default protocol is
a platform specific optimized local protocol. If the
protocol is omitted and a hostname is specified, then
the default protocol is rmi.
lvmid The local virtual machine identifier for the target JVM.
The lvmid is a platform-specific value that uniquely
identifies a JVM on a system. The lvmid is the only
required component of a virtual machine identifier. The
lvmid is typically, but not necessarily, the operating
system's process identifier for the target JVM process.
You can use the jps command to determine the lvmid.
Also, you can determine lvmid on Unix platforms with the
ps command, and on Windows with the Windows Task Man-
ager.
hostname A hostname or IP address indicating the target host. If
hostname is omitted, then the target host is the local
host.
port The default port for communicating with the remote
server. If the hostname is omitted or the protocol spec-
ifies an optimized, local protocol, then port is
ignored. Otherwise, treatment of the port parameter is
implementation specific. For the default rmi protocol,
the port indicates the port number for the rmiregistry
on the remote host. If port is omitted, and protocol
indicates rmi, then the default rmiregistry port (1099)
is used.
servername The treatment of this parameter depends on implementa-
tion. For the optimized local protocol, this field is
ignored. For the rmi protocol, it represents the name of
the RMI remote object on the remote host.
PARAMETERS
generalOption A single general command-line option (-help, -options,
or -version)
outputOptions One or more output options, consisting of a single
statOption, plus any of the -t, -h, and -J options.
vmid Virtual machine identifier, a string indicating the tar-
get Java virtual machine (JVM). The general syntax is
[protocol:][//]lvmid[@hostname[:port]/servername
The syntax of the vmid string largely corresponds to the syntax of a
URI. The vmid can vary from a simple integer representing a local JVM
to a more complex construction specifying a communications protocol,
port number, and other implementation-specific values. See Virtual
Machine Identifier below for details.
interval[s|ms] Sampling interval in the specified units, seconds (s) or
milliseconds (ms). Default units are milliseconds. Must
be a positive integer. If specified, jstat will produce
its output at each interval.
count Number of samples to display. Default value is infinity;
that is, jstat displays statistics until the target JVM
terminates or the jstat command is terminated. Must be
a positive integer.
OPTIONS
The jstat command supports two types of options, general options and
output options. General options cause jstat to display simple usage
and version information. Output options determine the content and for-
mat of the statistical output.
NOTE- All options, and their functionality are subject to change or
removal in future releases.
GENERAL OPTIONS
If you specify one of the general options, you cannot specify any other
option or parameter.
-help Display help message.
-version Display version information.
-options Display list of statistics options. See the Output
Options section below.
OUTPUT OPTIONS
If you do not specify a general option, then you can specify output
options. Output options determine the content and format of jstat's
output, and consist of a single statOption, plus any of the other out-
put options (-h, -t, and -J). The statOption must come first.
Output is formatted as a table, with columns are separated by spaces.
A header row with titles describes the columns. Use the -h option to
set the frequency at which the header is displayed. Column header
names are generally consistent between the different options. In gen-
eral, if two options provide a column with the same name, then the data
source for the two columns are the same.
Use the -t option to display a time stamp column, labeled Timestamp as
the first column of output. The Timestamp column contains the elapsed
time, in seconds, since startup of the target JVM. The resolution of
the time stamp is dependent on various factors and is subject to varia-
tion due to delayed thread scheduling on heavily loaded systems.
Use the interval and count parameters to determine how frequently and
how many times, respectively, jstat displays its output.
NOTE- You are advised not to write scripts to parse jstat's output
since the format may change in future releases. If you choose to write
scripts that parse jstat output, expect to modify them for future
releases of this tool.
-statOption Determines the statistics information that jstat dis-
plays. The following table lists the available options.
Use the -options general option to display the list of
options for a particular platform installation.
+-----------------+------------------------------------------------------+
| Option | Displays... |
+-----------------+------------------------------------------------------+
|class | Statistics on the behavior of the class loader |
|compiler | Statistics on the behavior of the HotSpot Just-In- |
| | Time compiler |
|gc | Statistics on the behavior of the garbage collected |
| | heap |
|gccapacity | Statistics of the capacities of the generations and |
| | their corresponding spaces. |
|gccause | Summary of garbage collection statistics (same as |
| | -gcutil), with the cause of the last and current (if |
| | applicable) garbage collection events. |
|gcnew | Statistics of the behavior of the new generation. |
|gcnewcapacity | Statistics of the sizes of the new generations and |
| | its corresponding spaces. |
|gcold | Statistics of the behavior of the old and permanent |
| | generations. |
|gcoldcapacity | Statistics of the sizes of the old generation. |
|gcpermcapacity | Statistics of the sizes of the permanent generation. |
|gcutil | Summary of garbage collection statistics. |
|printcompilation | Summary of garbage collection statistics. |
+-----------------+------------------------------------------------------+
-h n Display a column header every n samples (output rows),
where n is a positive integer. Default value is 0, which
displays the column header above the first row of data.
-t n Display a timestamp column as the first column of out-
put. The timestamp is the the time since the start time
of the target JVM.
-JjavaOption Pass javaOption to the java application launcher. For
example, -J-Xms48m sets the startup memory to 48
megabytes. For a complete list of options, see java(1).
STATOPTIONS AND OUTPUT
The following tables summarize the columns that jstat outputs for each
statOption.
class Class Loader Statistics
+---------+--------------------------------------------------------+
| Column | Description |
+---------+--------------------------------------------------------+
|Loaded | Number of classes loaded |
|Bytes | Number of Kbytes loaded |
|Unloaded | Number of classes unloaded |
|Bytes | Number of Kbytes unloaded |
|Time | Time spent performing class load and unload operations |
+---------+--------------------------------------------------------+
compiler
HotSpot Just-In-Time Compiler Statistics
+-------------+-------------------------------------------------------+
| Column | Description |
+-------------+-------------------------------------------------------+
|Compiled | Humber of compilation tasks performed |
|Failed | Number of compilation tasks that failed |
|Invalid | Number of compilation tasks that were invalidated |
|Time | Time spent performing compilation tasks |
|FailedType | Compile type of the last failed compilation |
|FailedMethod | Class name and method for the last failed compilation |
+-------------+-------------------------------------------------------+
gc Garbage-collected heap statistics
+-------+-------------------------------------------+
|Column | Description |
+-------+-------------------------------------------+
|SOC | Current survivor space 0 capacity (KB). |
|S1C | Current survivor space 1 capacity (KB). |
|S0U | Survivor space 0 utilization (KB). |
|S1U | Survivor space 1 utilization (KB). |
|EC | Current eden space capacity (KB). |
|EU | Eden space utilization (KB). |
|OC | Current old space capacity (KB). |
|OU | Old space utilization (KB). |
|PC | Current permanent space capacity (KB). |
|PU | Permanent space utilization (KB). |
|YGC | Number of young generation GC Events. |
|YGCT | Young generation garbage collection time. |
|FGC | Number of full GC events. |
|FGCT | Full garbage collection time. |
|GCT | Total garbage collection time. |
+-------+-------------------------------------------+
gccapacity
Memory Pool Generation and Space Capacities
+-------+---------------------------------------------+
|Column | Description |
+-------+---------------------------------------------+
|NGCMN | Minimum new generation capacity (KB). |
|NGCMX | Maximum new generation capacity (KB). |
|NGC | Current new generation capacity (KB). |
|S0C | Current survivor space 0 capacity (KB). |
|S1C | Current survivor space 1 capacity (KB). |
|EC | Current eden space capacity (KB). |
|OGCMN | Minimum old generation capacity (KB). |
|OGCMX | Maximum old generation capacity (KB). |
|OGC | Current old generation capacity (KB). |
|OC | Current old space capacity (KB). |
|PGCMN | Minimum permanent generation capacity (KB). |
|PGCMX | Maximum Permanent generation capacity (KB). |
|PGC | Current Permanent generation capacity (KB). |
|PC | Current Permanent space capacity (KB). |
|VGC | Number of Young generation GC Events. |
|FGC | Number of Full GC Events. |
+-------+---------------------------------------------+
gccause
This option displays the same summary of garbage collection sta-
tistics as the -gcutil option, but includes the causes of the
last garbage collection event and (if applicable) the current
garbage collection event. In addition to the columns listed for
-gcutil, this option adds the following columns:
+-------+--------------------------------------+
|Column | Description |
+-------+--------------------------------------+
|LGCC | Cause of last Garbage Collection. |
|GCC | Cause of current Garbage Collection. |
+-------+--------------------------------------+
gcnew New Generation Statistics
+-------+-------------------------------------------+
|Column | Description |
+-------+-------------------------------------------+
|SOC | Current survivor space 0 capacity (KB). |
|S1C | Current survivor space 1 capacity (KB). |
|S0U | Survivor space 0 utilization (KB). |
|S1U | Survivor space 1 utilization (KB). |
|TT | Tenuring threshold. |
|MTT | Maximum tenuring threshold. |
|DSS | Desired survivor size (KB). |
|EC | Current eden space capacity (KB). |
|EU | Eden space utilization (KB). |
|VGC | Number of young generation GC events. |
|VGCT | Young generation garbage collection time. |
+-------+-------------------------------------------+
gcnewcapacity
New Generation Space Size Statistics
+-------+-----------------------------------------+
|Column | Description |
+-------+-----------------------------------------+
|NGCMN | Minimum new generation capacity (KB). |
|NGCMX | Maximum new generation capacity (KB). |
|NGC | Current new generation capacity (KB). |
|S0CMX | Maximum survivor space 0 capacity (KB). |
|S0C | Current survivor space 0 capacity (KB). |
|S1CMX | Maximum survivor space 1 capacity (KB). |
|S1C | Current survivor space 1 capacity (KB). |
|ECMX | Maximum eden space capacity (KB). |
|EC | Current eden space capacity (KB). |
|YGC | Number of young generation GC events. |
|FGC | Number of Full GC Events. |
+-------+-----------------------------------------+
gcold Old and Permanent Generation Statistics
+-------+----------------------------------------+
|Column | Description |
+-------+----------------------------------------+
|PC | Current permanent space capacity (KB). |
|PU | Permanent space utilization (KB). |
|OC | Current old space capacity (KB). |
|OU | Old space utilization (KB). |
|YGC | Number of young generation GC events. |
|FGC | Number of Full GC events. |
|FGCT | Full garbage collection time. |
|GCT | Total garbage collection time. |
+-------+----------------------------------------+
gcoldcapacity
Old Generation Statistics
+-------+---------------------------------------+
|Column | Description |
+-------+---------------------------------------+
|OGCMN | Minimum old generation capacity (KB). |
|OGCMV | Maximum old generation capacity (KB). |
|OGC | Current old generation capacity (KB). |
|OC | Current old space capacity (KB). |
|YGC | Number of young generation GC events. |
|FGC | Number of Full GC events. |
|FGCT | Full garbage collection time. |
|GCT | Total garbage collection time. |
+-------+---------------------------------------+
gcpermcapacity
Permanent Generation Statistics
+-------+---------------------------------------------+
|Column | Description |
+-------+---------------------------------------------+
|PGCMN | Minimum permanent generation capacity (KB). |
|PGCMX | Maximum permanent generation capacity (KB). |
|PGC | Current permanent generation capacity (KB). |
|PC | Current permanent space capacity (KB). |
|YGC | Number of young generation GC events. |
|FGC | Number of Full GC events. |
|FGCT | Full garbage collection time. |
|GCT | Total garbage collection time. |
+-------+---------------------------------------------+
gcutil Summary of Garbage Collection Statistics
+-------+-------------------------------------------+
|Column | Description |
+-------+-------------------------------------------+
|S0 | Survivor space 0 utilization as a per- |
| | centage of the space's current capacity. |
|S1 | Survivor space 1 utilization as a per- |
| | centage of the space's current capacity. |
|E | Eden space utilization as a percentage of |
| | the space's current capacity. |
|O | Old space utilization as a percentage of |
| | the space's current capacity. |
|P | Permanent space utilization as a percent- |
| | age of the space's current capacity. |
|YGC | Number of young generation GC events. |
|YGCT | Young generation garbage collection time. |
|FGC | Number of Full GC events. |
|FGCT | Full garbage collection time. |
|GCT | Total garbage collection time. |
+-------+-------------------------------------------+
printcompilation
HotSpot Compiler Method Statistics
+---------+---------------------------------------------+
| Column | Description |
+---------+---------------------------------------------+
|Compiled | Number of compilation tasks performed. |
|Size | Number of bytes of bytecode for the method. |
|Type | Compilation type. |
|Method | Class name and method name identifying the |
| | compiled method. Class name uses "/" |
| | instead of "." as namespace separator. |
| | Method name is the method within the given |
| | class. The format for these two fields is |
| | consistent with the HotSpot - XX:+PrintCom- |
| | plation option. |
+---------+---------------------------------------------+
EXAMPLES
This section presents some examples of monitoring a local JVM with a
lvmid of 21891.
Using the gcutil option
This example attaches to lvmid 21891 and takes 7 samples at 250 mil-
lisecond intervals and displays the output as specified by the -gcutil
option.
jstat -gcutil 21891 250 7
S0 S1 E O P YGC YGCT FGC FGCT GCT
12.44 0.00 27.20 9.49 96.70 78 0.176 5 0.495 0.672
12.44 0.00 62.16 9.49 96.70 78 0.176 5 0.495 0.672
12.44 0.00 83.97 9.49 96.70 78 0.176 5 0.495 0.672
0.00 7.74 0.00 9.51 96.70 79 0.177 5 0.495 0.673
0.00 7.74 23.37 9.51 96.70 79 0.177 5 0.495 0.673
0.00 7.74 43.82 9.51 96.70 79 0.177 5 0.495 0.673
0.00 7.74 58.11 9.51 96.71 79 0.177 5 0.495 0.673
The output of this example shows that a young generation collection
occurred between the 3rd and 4th sample. The collection took 0.001 sec-
onds and promoted objects from the eden space (E) to the old space (O),
resulting in an increase of old space utilization from 9.49% to 9.51%.
Before the collection, the survivor space was 12.44% utilized, but
after this collection it is only 7.74% utilized.
Repeating the column header string
This example attaches to lvmid 21891 and takes samples at 250 millisec-
ond intervals and displays the output as specified by -gcutil option.
In addition, it uses the -h3 option to output the column header after
every 3 lines of data.
jstat -gcnew -h3 21891 250
S0C S1C S0U S1U TT MTT DSS EC EU YGC YGCT
64.0 64.0 0.0 31.7 31 31 32.0 512.0 178.6 249 0.203
64.0 64.0 0.0 31.7 31 31 32.0 512.0 355.5 249 0.203
64.0 64.0 35.4 0.0 2 31 32.0 512.0 21.9 250 0.204
S0C S1C S0U S1U TT MTT DSS EC EU YGC YGCT
64.0 64.0 35.4 0.0 2 31 32.0 512.0 245.9 250 0.204
64.0 64.0 35.4 0.0 2 31 32.0 512.0 421.1 250 0.204
64.0 64.0 0.0 19.0 31 31 32.0 512.0 84.4 251 0.204
S0C S1C S0U S1U TT MTT DSS EC EU YGC YGCT
64.0 64.0 0.0 19.0 31 31 32.0 512.0 306.7 251 0.204
In addition to showing the repeating header string, this example shows
that between the 2nd and 3rd samples, a young GC occurred. Its duration
was 0.001 seconds. The collection found enough live data that the sur-
vivor space 0 utilization (S0U) would would have exceeded the desired
survivor Size (DSS). As a result, objects were promoted to the old gen-
eration (not visible in this output), and the tenuring threshold (TT)
was lowered from 31 to 2.
Another collection occurs between the 5th and 6th samples. This collec-
tion found very few survivors and returned the tenuring threshold to
31.
Including a time stamp for each sample
This example attaches to lvmid 21891 and takes 3 samples at 250 mil-
lisecond intervals. The -t option is used to generate a time stamp for
each sample in the first column.
jstat -gcoldcapacity -t 21891 250 3
Timestamp OGCMN OGCMX OGC OC YGC FGC FGCT GCT
150.1 1408.0 60544.0 11696.0 11696.0 194 80 2.874 3.799
150.4 1408.0 60544.0 13820.0 13820.0 194 81 2.938 3.863
150.7 1408.0 60544.0 13820.0 13820.0 194 81 2.938 3.863
Monitor instrumentation for a remote JVM
This example attaches to lvmid 40496 on the system named remote.domain
using the -gcutil option, with samples taken every second indefinitely.
jstat -gcutil [email protected] 1000
... output omitted
The lvmid is combined with the name of the remote host to construct a
vmid of [email protected]. This vmid results in the use of the rmi
protocol to communicate to the default jstatd server on the remote
host. The jstatd server is located using the rmiregistry on
remote.domain that is bound to the default rmiregistry port (port
1099).
SEE ALSO
java(1) jps(1) jstatd(1) rmiregistry(1)
13 June 2004 jstat(1)
jstatd
虚拟机统计信息监控工具守护进程,可以方便的建立远程 RMI 服务器,这样就可以通过jvisualvm分析远程服务器上的 jvm 统计信息了。
# 详细的说明可以阅读下面命令返回的信息
$ info jstatd

# 首先给 jstatd 访问权限
$ vim ./jstatd.all.policy
grant codebase "file:${java.home}/../lib/tools.jar" {
           permission java.security.AllPermission;
       };

# 启动 jstatd,这样 jvisualvm 就可以通过 jstatd 所在的服务器 host 和 port 获取 jvm 统计信息了
$ jstatd -J-Djava.security.policy=./jstatd.all.policy -J-Djava.rmi.server.hostname=192.168.51.82 -p 2020 &
在jvisualvm添加一个远程服务器,图形界面右键远程,添加远程主机(H)...,主机名写192.168.51.82,点高级设置,端口(P):改为2020,确认即可。
当使用jstatd + jvisualvm监控远程 JVM 的时候,你会发现无法获得 JVM 的 Cpu、Thread、MBean 等信息,它会提示你使用JMX连接。参考连接
jinfo
Java 配置信息工具:显示虚拟机配置信息,比如给 main 方法的提交参数等
当 JVM 由于自身异常 Crashed 的时候,往往没有
*.hprof文件,而是生成类似core.3742的文件,core.3742是 core dump 文件,当程序运行的过程中异常终止或崩溃,操作系统会将程序当时的内存状态记录下来,保存在一个文件中,这种行为就叫做 core dump,可以理解为是操作系统在程序崩溃时为其保存的内存快照,其中3742是pid,它的命名规则通过/proc/sys/kernel/core_pattern的值控制,因此你生成的 core dump 文件不一定和我的命名规则一样。注意,需要保证ulimit -c unlimited才会在系统崩溃的时候生成core.xxx,默认ulimit -c是0,不生成。除了系统崩溃时生成 core dump,在系统卡住或者 cpu 使用率很高的时候也可以手动触发kill -3 <pid>吓唬下 JVM 生成 core dump 文件。Mac core dump 文件默认生成到/cores/core.pid
$ jinfo
Usage:
    jinfo [option] <pid>
        (to connect to running process)
    jinfo [option] <executable> <core>
        (to connect to a core file)
    jinfo [option] [server_id@]<remote server IP or hostname>
        (to connect to remote debug server)

where <option> is one of:
    -flag <name>         to print the value of the named VM flag
    -flag [+|-]<name>    to enable or disable the named VM flag
    -flag <name>=<value> to set the named VM flag to the given value
    -flags               to print VM flags
    -sysprops            to print Java system properties
    <no option>          to print both of the above
    -h | -help           to print this help message
查看一个 core dump 的 vm flags
$ jinfo -flags $JAVA_HOME/bin/java core.3742

Attaching to core core.3742 from executable /usr/java/jdk1.8.0_181-amd64/bin/java, please wait...
Debugger attached successfully.
Server compiler detected.
JVM version is 25.181-b13
Non-default VM flags: -XX:CICompilerCount=3 -XX:InitialHeapSize=526385152 -XX:MaxHeapSize=8392802304 -XX:MaxNewSize=2797600768 -XX:MinHeapDeltaBytes=524288 -XX:NewSize=175112192 -XX:OldSize=351272960 -XX:+UseCompressedClassPointers -XX:+UseCompressedOops -XX:+UseFastUnorderedTimeStamps -XX:+UseParallelGC
Command line:
jstack
Java 堆栈跟踪工具:显示虚拟机的线程堆栈信息
$ jstack
Usage:
    jstack [-l] <pid>
        (to connect to running process)
    jstack -F [-m] [-l] <pid>
        (to connect to a hung process)
    jstack [-m] [-l] <executable> <core>
        (to connect to a core file)
    jstack [-m] [-l] [server_id@]<remote server IP or hostname>
        (to connect to a remote debug server)

Options:
    -F  to force a thread dump. Use when jstack <pid> does not respond (process is hung)
    -m  to print both java and native frames (mixed mode)
    -l  long listing. Prints additional information about locks
    -h or -help to print this help message
attach core dump 文件
$ jstack $JAVA_HOME/bin/java core.3742

Attaching to core core.3742 from executable /usr/java/jdk1.8.0_181-amd64/bin/java, please wait...
Debugger attached successfully.
Server compiler detected.
JVM version is 25.181-b13
Deadlock Detection:

No deadlocks found.

Thread 28312: (state = BLOCKED)
 - sun.misc.Unsafe.park(boolean, long) @bci=0 (Compiled frame; information may be imprecise)
 - java.util.concurrent.locks.LockSupport.park(java.lang.Object) @bci=14, line=175 (Interpreted frame)
 - java.util.concurrent.locks.AbstractQueuedSynchronizer.parkAndCheckInterrupt() @bci=1, line=836 (Interpreted frame)
 - java.util.concurrent.locks.AbstractQueuedSynchronizer.acquireQueued(java.util.concurrent.locks.AbstractQueuedSynchronizer$Node, int) @bci=67, line=870 (Interpreted frame)
 - java.util.concurrent.locks.AbstractQueuedSynchronizer.acquire(int) @bci=17, line=1199 (Compiled frame)
 - java.util.concurrent.locks.ReentrantLock$NonfairSync.lock() @bci=21, line=209 (Compiled frame)
 - java.util.concurrent.locks.ReentrantLock.lock() @bci=4, line=285 (Compiled frame)
 - com.rich.rockfs.server.Rockfs.getWritableRocksDB(com.rich.rockfs.beans.DBInfo) @bci=85, line=97 (Compiled frame)
 - com.rich.rockfs.server.RockServerImpl.batchPut(com.rich.rockfs.beans.MultiplePutRequest, io.grpc.stub.StreamObserver) @bci=15, line=128 (Compiled frame)
 - com.rich.rockfs.server.RocksServerGrpc$MethodHandlers.invoke(java.lang.Object, io.grpc.stub.StreamObserver) @bci=90, line=472 (Interpreted frame)
 - io.grpc.stub.ServerCalls$UnaryServerCallHandler$UnaryServerCallListener.onHalfClose() @bci=53, line=171 (Compiled frame)
 - io.grpc.internal.ServerCallImpl$ServerStreamListenerImpl.halfClosed() @bci=15, line=283 (Compiled frame)
 - io.grpc.internal.ServerImpl$JumpToApplicationThreadServerStreamListener$1HalfClosed.runInContext() @bci=7, line=761 (Compiled frame)
 - io.grpc.internal.ContextRunnable.run() @bci=9, line=37 (Compiled frame)
 - io.grpc.internal.SerializingExecutor.run() @bci=18, line=123 (Compiled frame)
 - java.util.concurrent.ThreadPoolExecutor.runWorker(java.util.concurrent.ThreadPoolExecutor$Worker) @bci=95, line=1149 (Interpreted frame)
 - java.util.concurrent.ThreadPoolExecutor$Worker.run() @bci=5, line=624 (Interpreted frame)
 - java.lang.Thread.run() @bci=11, line=748 (Interpreted frame)

...
jmap
Java 内存映像工具
- 查看 JVM 堆内存划分与使用情况
- 生成虚拟机的堆内存转储快照(heap dump)
# 查看使用方法
$ jmap
Usage:
    jmap [option] <pid>
        (to connect to running process)
    jmap [option] <executable> <core>
        (to connect to a core file)
    jmap [option] [server_id@]<remote server IP or hostname>
        (to connect to remote debug server)

where <option> is one of:
    <none>               to print same info as Solaris pmap
    -heap                to print java heap summary
    -histo[:live]        to print histogram of java object heap; if the "live"
                         suboption is specified, only count live objects
    -clstats             to print class loader statistics
    -finalizerinfo       to print information on objects awaiting finalization
    -dump:<dump-options> to dump java heap in hprof binary format
                         dump-options:
                           live         dump only live objects; if not specified,
                                        all objects in the heap are dumped.
                           format=b     binary format
                           file=<file>  dump heap to <file>
                         Example: jmap -dump:live,format=b,file=heap.bin <pid>
    -F                   force. Use with -dump:<dump-options> <pid> or -histo
                         to force a heap dump or histogram when <pid> does not
                         respond. The "live" suboption is not supported
                         in this mode.
    -h | -help           to print this help message
    -J<flag>             to pass <flag> directly to the runtime system
# 查看指定 java 进程堆内存分配情况
$ jmap -heap 8357
Attaching to process ID 8357, please wait...
Debugger attached successfully.
Server compiler detected.
JVM version is 25.181-b13

using thread-local object allocation.
Parallel GC with 6 thread(s)

Heap Configuration:
 MinHeapFreeRatio         = 0
 MaxHeapFreeRatio         = 100
 MaxHeapSize              = 8392802304 (8004.0MB)
 NewSize                  = 175112192 (167.0MB)
 MaxNewSize               = 2797600768 (2668.0MB)
 OldSize                  = 351272960 (335.0MB)
 NewRatio                 = 2
 SurvivorRatio            = 8
 MetaspaceSize            = 21807104 (20.796875MB)
 CompressedClassSpaceSize = 1073741824 (1024.0MB)
 MaxMetaspaceSize         = 17592186044415 MB
 G1HeapRegionSize         = 0 (0.0MB)

Heap Usage:
PS Young Generation
Eden Space:
 capacity = 132120576 (126.0MB)
 used     = 42286136 (40.32720184326172MB)
 free     = 89834440 (85.67279815673828MB)
 32.00571574862041% used
From Space:
 capacity = 21495808 (20.5MB)
 used     = 0 (0.0MB)
 free     = 21495808 (20.5MB)
 0.0% used
To Space:
 capacity = 21495808 (20.5MB)
 used     = 0 (0.0MB)
 free     = 21495808 (20.5MB)
 0.0% used
PS Old Generation
 capacity = 351272960 (335.0MB)
 used     = 0 (0.0MB)
 free     = 351272960 (335.0MB)
 0.0% used

4277 interned Strings occupying 340832 bytes.


# 从 core dump 中分析 java 堆内存分配情况
$ jmap -heap $JAVA_HOME/bin/java core.3742


# 从 core dump 中抽取`hprof`类型的 heap dump 文件,可以丢给 JProfiler 做更详细的分析
$ jmap -dump:format=b,file=java_pid3742.hprof $JAVA_HOME/bin/java core.3742


# 生成 pid=3742 的 java 进程的 heap dump 文件
$ jmap -dump:format=b,file=java_pid3742.hprof $JAVA_HOME/bin/java 3742
jcmd
It is recommended to use the latest utility,
jcmdinstead ofjmaputility for enhanced diagnostics and reduced performance overhead. See Useful Commands for jcmd Utility.
# 生成 pid=3742 的 java 进程的 heap dump 文件
$ jcmd 3742 GC.heap_dump filename=java_pid3742.hprof
jhat
虚拟机堆转储快照分析工具:用于分析 heap dump 文件,它会建立一个 HTTP/HTML 服务器,让用户可以在浏览器上查看分析结果
一般不会直接使用 jhat 去分析 heap dump 文件,因为它的功能比较简陋。一般都会把转储文件拷贝到其他节点,使用更强大的 JProfiler/VisualVM/MAT 进行分析。
jvisualvm
$ jvisualvm
jvisualvm默认没有安装Visual GC插件,需要手动安装,打开jvisualvm后,工具->插件->可用插件->Visual GC->安装,这样就可以以可视化的方式查看整个GC的过程
jmc
使用 Java Mission Control 监控和管理 Java 程序,它使用 JVM 的常规自适应动态收集数据,能够最小化额外的性能开销,并且消除了观察器效应的问题,JMC由客户端和一些插件组成。
# Install jmc
$ tar -zxvf jmc-8.0.0_osx-x64.tar.gz && cd jmc-8.0.0_osx-x64
$ sudo mv JDK\ Mission\ Control.app /Library/Java/JavaVirtualMachines/
$ vim ~/.zshrc
export PATH="/Library/Java/JavaVirtualMachines/JDK Mission Control.app/Contents/MacOS":$PATH
$ source ~/.zshrc
$ which jmc
/Library/Java/JavaVirtualMachines/JDK Mission Control.app/Contents/MacOS/jmc
# 启动
$ jmc

# 覆盖jmc.ini文件中指定的那些选项
$ jmc -vmarg [args]

# 附加到jmc.ini文件中指定的选项
$ jmc --launcher.appendVmargs -vmarg [args]
默认连接本地 JVM 应用,如果要连接远程 JVM 应用,类似jvisualvm需要保证远程 JVM 应用启用了 JMX。
JVM
Java Garbage Collection
- Java Garbage Collection Basics
- HotSpot Virtual Machine Garbage Collection Tuning Guide Java SE 8
- Sizing the Generations of JVM
CMS
延迟低,吞吐小
ParallelGC
延迟高,吞吐大
-XX:+UseParallelGC
-XX:+UseParallelOldGC
对 ParallelGC 吞吐调优的目标是尽可能避免发生 Full GC,这就需要优化对象老化频率,可以调整 Survivor 空间实现对对象老化的优化。 使用 ParallelGC 时,垃圾收集的开销应小于 5%,如果已经减少到 1% 甚至更少,那基本上就已经达到了极限。
G1
延迟和吞吐比较均衡